
Visualizing information about Steam games in the form of interactive bubbles.
As part of a course called “Information Visualization”, we were tasked with finding some data and displaying it in new and interesting ways. We decided to work with data from SteamSpy, which is a website that gathers a lot of information about games on the Steam platform, such as sales, owners, playtime, ranking, etc.
Although SteamSpy is very useful if you know what you are looking for, it is more difficult to get an overview and see possible trends. In other words, there might simply be too much information to look through.
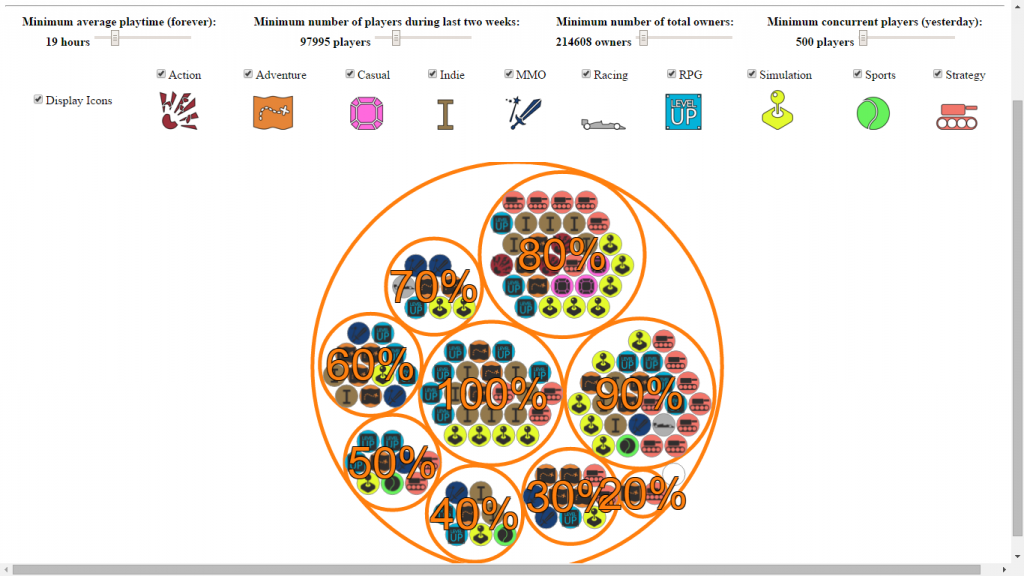
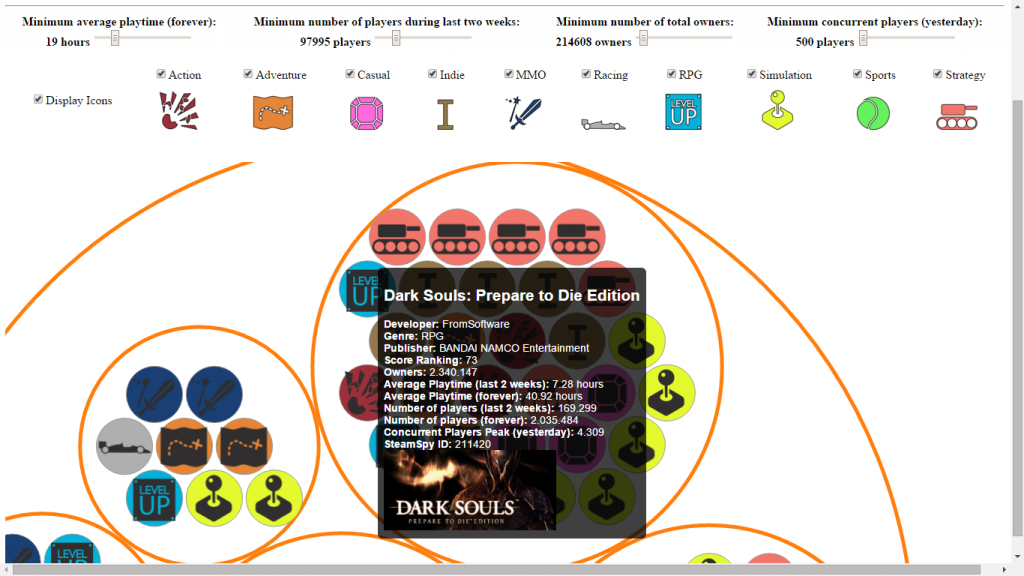
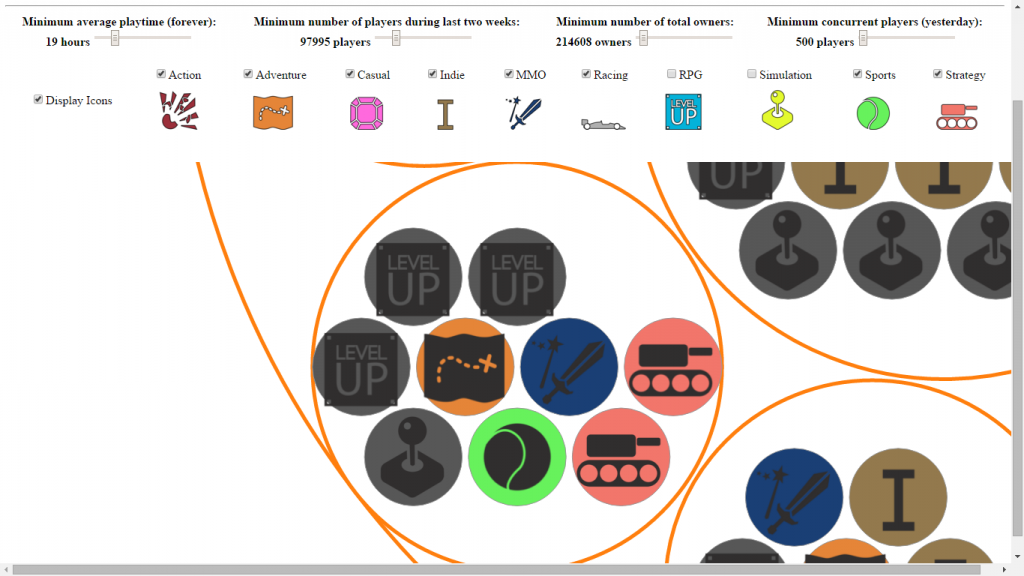
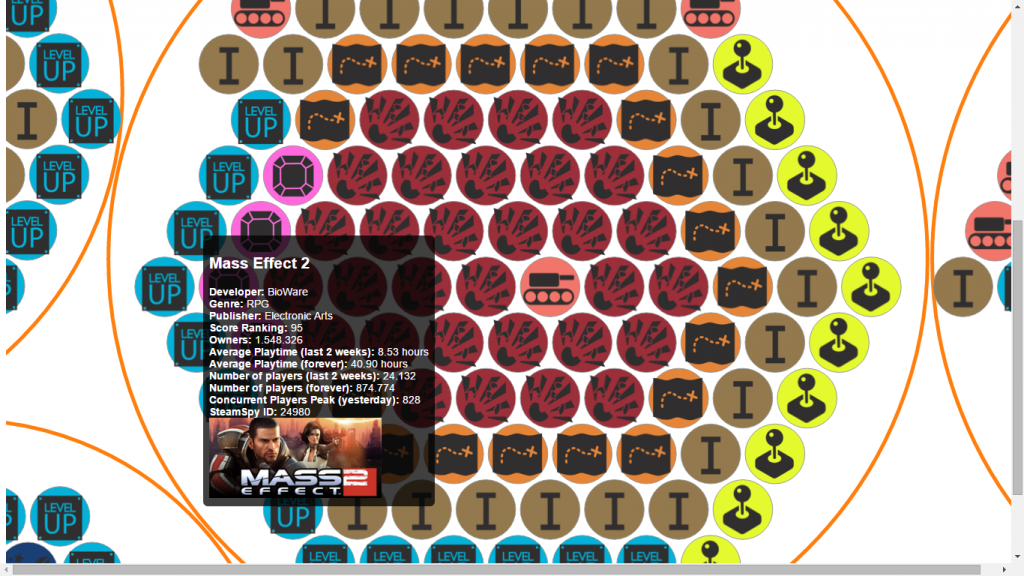
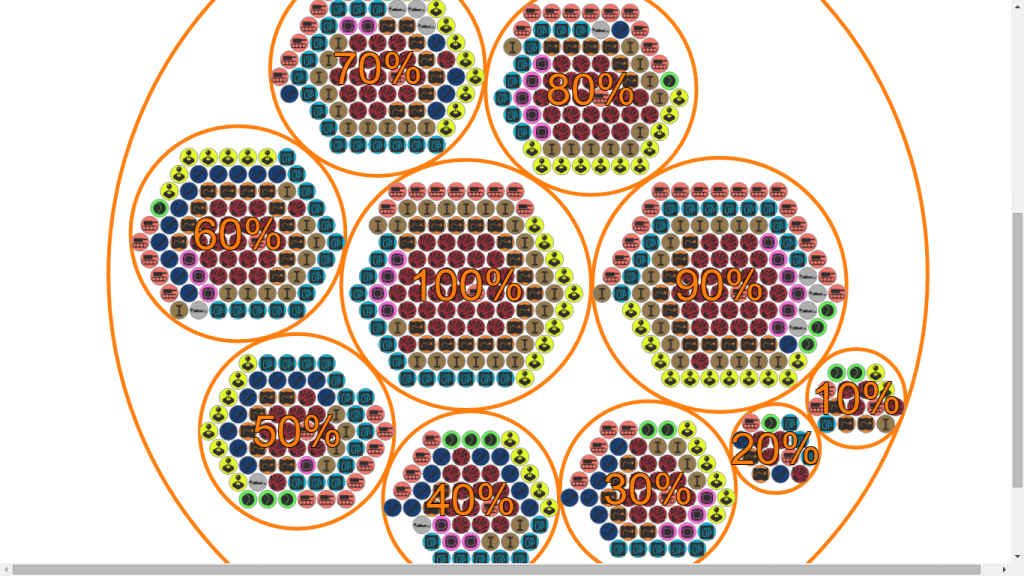
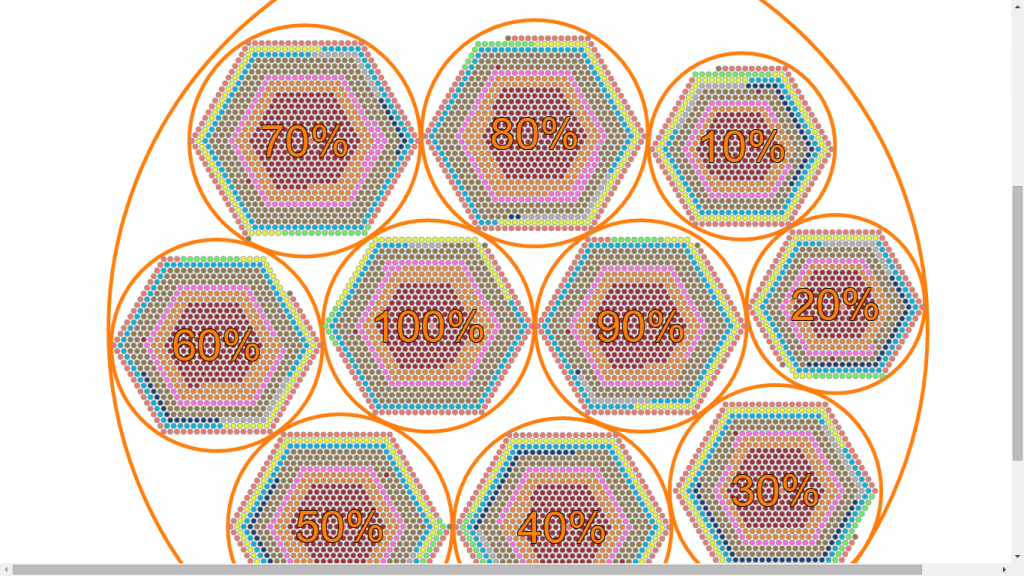
With Steam Bubbles, we utilized the D3.js library to present the Steam data in the form of interactive bubbles. They are organized by outher bubbles that represent the user review scores (from 0% to 100%). The bubbles are color-coded by genre. By hovering with the mouse, the user can get more information about each specific game. Sliders can also be used to set thresholds for what games should be shown, e.g., by setting the minimum average playtime or number of owners.

Credits
Anne Juhler Hansen
Gustav Dahl